Mount Evans Site Survey Status -- 1991-present
Meyer-Womble Observatory, University of Denver Observatories
4/22/99, R.E.Stencel (rstencel@du.edu)

We continue to assemble evidence that Mt.Evans may provide one of the best INFRARED and SUB-MILLIMETER SITES available in the CONTINENTAL U.S., due to its extreme high altitude (4,303 meters), accessibility (paved road to summit), infrastructure (new 2,100 sq ft observatory building, nearby base camp at 10,600 ft) and proximity to transportation, supplies and universities in Denver. A permit from the Forest Service has *already been obtained* for the addition of a 4 meter class telescope. An FCC license for broadband 6.5 GHz line of sight communication to Denver campus, 50 km distant, is also in hand.
Copy of Cloud cover and water vapor report by Andre Erasmus available on request to rstencel@du.edu
Note: Figures referenced hereafter are available
on request.
Update: 1991-1996 remote weather station summary.
SECTION 1 includes the basic METEOROLOGICAL conditions such as temperature, wind, humidity, and precipitation, based on nearly 5 years of in-situ monitoring with a remotely accessible weather station package.
SECTION 2 compiles a list of observations in an effort to determine the CLOUD COVER STATISTICS for the mountain, using a variety of means.
SECTION 3 discusses "SEEING" measurements that have been conducted at the summit, using double stars, acoustic soundings and differential image motion monitoring.
SECTION 4 addresses SKY BRIGHTNESS issues for the site.
SECTION 1: METEOROLOGICAL CONDITIONS
The University of Denver has continuously operated a modest
weather station atop Mount Evans since January of 1991. This station has
been outfitted with sensors to measure temperature, barometric pressure,
relative humidity, and wind speed and direction, plus battery voltage
maintained by solar panels. The station's data logger as been programmed
to pole the sensors every minute and report one hour averages as well as
minimum/maximum values and standard deviations for that hour. The bulk
of the data presented in this section has been acquired from this station.
Partial gaps in the data sets are due to occassional sensor malfunctions
during these periods. A pyranometer was added to the sensor package in
June of 1996. Although battery voltages, despite a voltage limiter in the
circuit, can indicate the fraction of sunny hours, the pyranometer will
provide more direct statistics.
A: TEMPERATURE
Temperature conditions are best illustrated in Figure 1A, where the
daily average, minimum, and maximum temperatures as a function of the
day of the year are plotted for each of the years between January 1991
and the present. The temperature profile is remarkably constant from
year to year with diurnal variations being on the order of 10 degrees
Fahrenheit. Also of special note is the infrequency of days below zero
degrees Fahrenheit. These results are significant because: (a) the hourly
temperature gradient is small, which minimizes thermal distortions, and
(b) operationally, one does not require engineering for supercold arctic
conditions (i.e. -60F).
B. WIND SPEED AND DIRECTION
Wind data is best represented by the following the graphs shown in
Figures 1B and 2B. Figure 1B shows a number distribution plot of average
and maximum hourly wind speeds for the four seasonal periods December-
February, March-May, June-August, and September-November. Median and
Mean wind speeds are also quoted for these seasons, averaging 25 to 30
knots, with sigma about 10 knots. Maximum winds measured to date have
not exceeded 90 knots, although construction should plan for higher
speeds.
Figure 2B plots the hourly averaged wind direction versus its
corresponding speed. These plots clearly demonstrate that when the wind
speeds are greater that 15 knots, the winds are tightly constrained to a
direction out or the west-south-west (Az = 255 degrees). Below this
value, the direction is more random but still preferentially out of this
west south-west direction. This result is important for several reasons:
(a) the average wind speed is comfortably below dome closure
requirements of 40 knots; (b) the wind direction is the most favorable for
inducing laminar flow over the observatory parcel, i.e. from the steep
western side of the ridge, cresting above the observatory and descending
to the east. This latter behavior accounts for the seeing stability noted
toward the west side of the sky (see image motion monitoring, below).
C. WATER VAPOR COLUMN
Relative humidity, barometric pressure, and temperature data can be
used to calculate the partial pressure of water vapor at the site (see
Allen, Astrophysical Quantities, 3rd ed., p.120). For the latitude of Mount
Evans, the partial pressure of water in millibars, nearly equates to the
vertical column of water in precipitable millimeters. A water column
less than 2 millimeters (<2mb) corresponds to excellent infrared
transparency. Figure 1C shows the daily average a well as the minimum
and maximum for the partial pressure of water as a function of day for a
given year. Data gaps are primarily due to failures in the relative
humidity sensor during those periods. The data shows excellent
conditions for infrared observations during the fall and winter months. If
the ground humidity is elevated due to surface evaporation, these results
represent upper limits to the dryness of the Mt. Evans site.
A more direct measurement of the water column was done using a
near infrared (1-2 micron) prism spectrometer featuring a single element
pyroelectric detector. The instrument was designed to measure the 1.1
and 1.4 micron absorption features of water using the sun as a source of
background continuum. Using the atmospheric transmission code RADCO,
we were able to deduce the water column from the measured equivalent
widths of the H2O absorption features. The results of the measurements
are listed in Table 1C. Results are consistent with values derived from
the temperature, barometric pressure, and relative humidity data for the
same time of day and year. Unfortunately, a direct comparison was not
possible due to a later discovery that the relative humidity sensor was
not operating properly during this time interval.
Individual p.w.v. column readings have been as low as a few hundred
microns.
A one hundred page report "Water Vapor as a Factor in the Selection of Solar
Observation Sites" by N.Medrud, NCAR/High Altitude Observatory, March 1970 is
available from R.Stencel/DU on request. It includes Rocky Mountain sites.
D. SNOWFALL
Daily records of snowfall have not been measured directly at the
summit, but such data has been acquired at our Echo Lake Lab, located
approximately 15 miles to the north at an elevation of 10,600 feet, during
the past several decades. This location should represent an adequate
proxy to the summit for measuring snowfall. In Figure 1D we present the
monthly snowfall amounts for the past six years running for the Echo Lake
locale. Note that December and January are very dry months as also
indicated from water vapor data. November and March are the snowiest
months with year to year variability being quite large. This is consistent
with experience of Colorado skiers, that there are fresh autumnal and
spring snows, separated by a sometimes long, mid-winter dry spell.
SECTION 2: CLOUD COVER STATISTICS
Cloud cover is certainly a very important parameter in determining
the quality of any astronomical site. This information, however, is
somewhat difficult to attain as one is generally interested in night time
conditions wherein cloud cover data is not readily available. For the
Mount Evans site, we believe that conditions at sunrise can serve as a
reliable proxy to conditions of the previous evening, at least for the
several hours prior to sunrise. In addition, morning daylight hours often
will be prime time for infrared observations. From the observations to
date, we conclude that conditions atop Mount Evans are Suitable For
Astronomy (SFA) 60+% of the time with roughly one half of those nights
(33% of the time) being of photometric quality. This is based on analysis
of satellite data, weather bureau data, line of sight observations and
climatology studies.
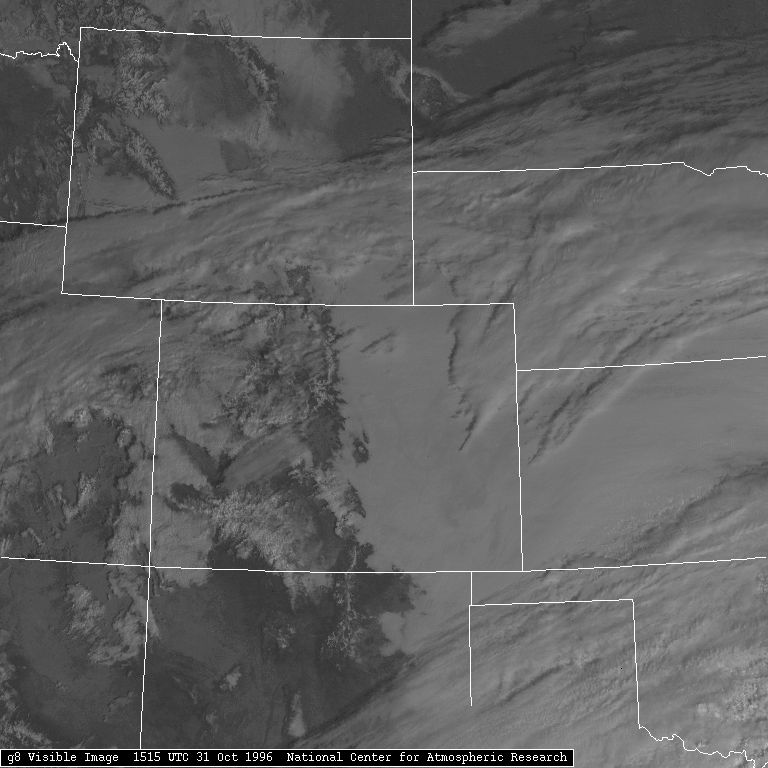
A: GOES Satellite Data
Utilizing GOES satellite data from 1988-1990, we present cloud
cover statistics for various observatory sites (pixel size 2.5 x 2.5 km)
across the western U.S. (D.Reinke, C.Combs, STC-METSAT, private comm.).
Figure 1A show the percent time cloudy at 9 a.m. for the summer and fall
months available. Early MORNING conditions show Mt. Evans to be quite
competitive with the established observatory sites shown, with
approximately 75% clear time. We were not able to use winter and spring
values, as the analysis technique used for this data interprets varying
ground-snow conditions as cloudy days.
B: Weather Bureau, and DU Line of Sight Observations
The US National Weather Service maintains cloud cover data records
for their Denver airport site covering daily observations in tenths of
daytime sky cover over many decades. Examining records fo the past
several years reveals a steady one-third split in morning observations
between clear, partly cloudy and overcast. We note that Denver airport
readings do not take into account localized weather on the summit (e.g.
cap clouds that would affect observing; upslope that would not).
Since January of 1994, line-of-sight observations from the
University of Denver campus to Mount Evans have been continuously
recorded mornings and evenings by Professor Stencel. Observations
recorded during morning hours are grouped into four basic categories:
During upslope conditions it not possible to ascertain conditions at the
summit. Therefore in principle, mornings placed in this category, may
possibly add to those in categories 1 or 2. In Figure 2B we present a
month to month summary for the percentage of time that conditions atop
Mt. Evans are photometric (1), SFA (1 plus 2), and undetermined (4). The
basic result is that 2/3 of the days are SFA, and 1/2 of those appeared
photometric. Experience with observing during summer 1998 showed that 24
of 42 nights were useable (57%) including monsoon periods of mid-July to
mid-Aug. Excluding those weeks increased the percentages toward 3 out of 4.
C: Thesis study on Cloud Climatology = 65% clear.
In this section we relate information reported in a 1981 Master's
thesis by Roger Lee Sorensen (Colorado Sate University, Fort Collins,
Colorado) entitled "Cloud and Insolation Climatology for Selected Colorado
Stations". Of most interest to conditions atop Mt. Evans was Sorensen's
study of cloud cover amounts for two observing stations, one in Denver
and the other in Colorado Springs. Sorensen computed monthly cloud cover
averages for a given hour of the day covering a 10 year time span (1952-
1961). The data is presented in Figure 1C. Cloud amounts for the
morning hours are consistent with observations presented in parts A and
B of this section. This data is somewhat difficult to gauge in that one
cannot ascertain the percentage of totally clear days from this study. For
example, the data shows that in the early morning hours of July, that the
average cloud cover is roughly 35%. On one hand, this could mean that 35%
of the days were totally cloudy and the others totally clear. On the other
hand, this could mean that each and every day was 35% cloudy. One must
also be cautious in using weather data from Denver as a proxy to
conditions atop Mt. Evans. However, it does appear representative of our
basic claim that 2/3 of the time is at least suitable for astronomy.
As this satellite image reveals, we occasionally see an "upslope" condition,
where a southern low will force moisture up against the foothills, but the
higher mountains remain in the clear.
SECTION 3: SEEING STATISTICS = subarcsecond, uncorrected.
Several measurements of the seeing quality atop Mt. Evans have been
completed with very promising results. Unfortunately, limited resources
have not permitted us to obtain measurements with extensive temporal
coverage, due to lack of commercial power at the summit for running
seeing monitors unattended. We plan, however, to augment measurements
with use of the Meyer Binocular Telescope beginning in the Fall of 1996.
This telescope should provide improved definition of the true seeing
statistics for the Mt. Evans site. In the following paragraphs we present
up to date seeing measurements conducted on Mt. Evans. A CDROM of 1998 data
obtained with an Apogee AP7 camera is available on request.
A: Acoustic Soundings
As reported by Stencel et al. (1995 BAAS 26:1321), vertical acoustic
sounding measurements were made at the Mt.Evans site during September
1994. Primary conclusions include that (a) refractive and turbulent
parameters are comparable to those reported at Mauna Kea by Forbes and
others; (b) the measured values imply the atmospheric contribution to the
seeing disk due to turblence in the 100 or so meters above the site is no
more than 0.1 arcsec; (c) the deduced Fried parameter based on these
measurements can be as large as one or more meters. C(n)2 values were found
to be comparable to Mauna Kea reported testing, circa 1E-17 m(-2/3).
See the full report (to be) appended below.
B: Double Star Images
CCD images were acquired at the summit for the double stars listed
in Table 1B. Double stars were used to accurately determine the plate
scale of the images. Seeing was ascertained by measuring the full width
half maximum of the individual stars. Visual inspection of the images at
the telescope suggest the camera did not ideally record the true seeing
quality, due to residual aberrations in the 10 and 24 inch telescopes used.
None of this data has been deconvolved with the telescope diffraction
limits (0.25 and 0.15 arcsec), nor enhanced by any active optics. Despite
these problems with CCD frames, it seems reasonable to conclude based
on these measurements that at least "arcsecond" quality seeing (0.68
arcsec formally) is routine on Mt. Evans. In addition, the telescopes were
housed in a ground level dome with no airflow or thermal compensation
for degrading effects from the dome. The Meyer Binocular Telescope
should be capable of doing superior measurements of this kind, because
airflow and thermal management has been included in its design (plus
provision for adaptive optics).
C: H-DIMM Survey
Hartmann mask differential image motion montoring offers the
potential to directly observe the seeing cell sizes and their fluctuations
(cf. Bally et al. 1995). We conducted a series of these measurements
during summer 1995 and present the results here. Fried parameters were
found to occur between 5 and 24 cm, and these appear to correlate with
azimuth of the star observed, being larger toward the west (windward)
side of the sky. Analysis is ongoing, and preliminary results show a
range of r(o) values from 5-10 cm on the leeward side of the observing site,
to 10-35 cm on the windward (upwind) side, as might be expected for air
flowing over the ridge. These values include unmitigated dome seeing effects.
D: Topography of Site
Mt. Evans experiences excellent seeing due to its isolated location
and elevation above surroundings. The site is situated some 3,000 feet
above tree line and the routine west-southwest winds come from a
direction that is unobstructed for several miles. The only local
obstruction to the telescope site is the true summit situated to the north.
Figure 1D shows several topographical surveys of the mountaintop. The
prevailing wind direction is also noted. Note the steep contours along the
southwestern slope, a feature known to conicide with sites of excellent
seeing such as the MMT on Mt Hopkins, Arizona.
SECTION 4: SKY BRIGHTNESS AND EXTINCTION
Preliminary measurements of sky brightness has been conducted
during September 1994, resulting in an estimated 21.5 mag/sq.arcsec, V
band, zenith. This compares favorably with estimates by Garstang (1995)
of sky brightness at Mt.Evans. Natural background of 22 mag/sq.arcsec is
almost achieved, and factors involving solar activity and regional forest
fire smoke could be factors in the results to date. A new series of
observations is planned with the Meyer Binocular Telescope this autumn.
The city lights of Denver fortunately do not affect more than about 5 to 10
degrees of the eastern sky due to relatively low altitude scattering and a
semi-stable inversion layer over the city.
UBVRIJHKLMNQ extinction studies are planned for 1999, once the new scope
is on-line.
===========================================================================
TABLE 1.c COMPUTED MEAN WATER COLUMNS BY MONTH FOR 1995
---------------------------------------------------------------------------
Month	 Computed millibars H20     Equivalent mm prec.H20
JANUARY	  1.5				1.1
FEBRUARY  1.5 				1.1
MARCH     2.0 				1.5
APRIL     2.0 				1.5
MAY       2.5 				1.9
JUNE      3.5 				2.6
JULY      4.3 				3.3
AUGUST    5.5 (monsoon)			4.1
SEPTEMBER 3.0 				2.3
OCTOBER   2.3 				1.7
NOVEMBER  1.5 				1.1
DECEMBER  1.5 				1.1
---------------------------------------------------------------------------
Note: 1 atm = 760 mm = 1013 mb pressure at sea level, 0.75 mm/mb ratio.
---------------------------------------------------------------------------
Recently, JHK region atmospheric daytime spectra were obtained
with the DU ASTI spectrometer -- see Figure 1c.
	1) clear, potentially photometric skies;
	2) partly cloudy but SFA (suitable for astronomy, spectroscopic);
	3) mostly cloudy and not SFA;
	4) upslope conditions.
===========================================================================
TABLE 2.b FRACTION (%) OF OVERNIGHTS AT LEAST PHOTOMETRIC & SPECTROSCOPIC
---------------------------------------------------------------------------
     Quarter:	WINTER		SPRING		SUMMER		FALL
YEAR		am  pm  nt	am  pm  nt	am  pm  nt	am  pm  nt
1994			62		62		62	74  51  50
1995		71  62  62	56  52  52	75  65  65	70  64  58
1996		63  60  56	65  59  56	76  67  64	48* 55* 48*
1997		50* 53  50	57  45  45	62* 53* 53	52* 58  52
1998		--  --  --	--  --  --		68**		65**
1999			52**
---------------------------------------------------------------------------
Aves:		61  58  56	59  52  54	71  62  62	61  57  55
Range		10   4	 6	 6   7	 8	 9   9   6	13   7  10
---------------------------------------------------------------------------
Notes: WINTER=JanFebMar  SPRING=AprMayJun  SUMMER=JulAugSep  FALL=OctNovDec
am = morning line of sight (with hours before sunrise prob clear).
pm = evening suitable for astron (workable clear evening).
nt = evening and following morning BOTH indicating good astron weather.
*ElNino weather pattern influence, arrived fall'96.  Similar comments are
reported for the VLT/Paranal, Chile site by Giacconi et al. 1999 A&A 343:L3.
** Readings after 1997 are derived from hourly photovoltaic data records.
Details of the daily records that figure into this summary are available on
request.
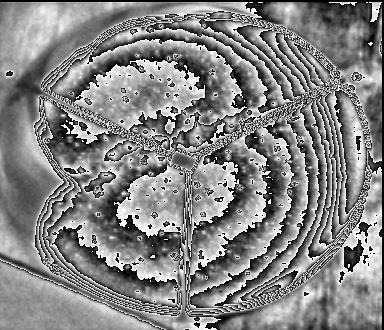 An all-sky visible-light image, 60 minutes on high speed film. In the original,
the Milky Way is clearly seen overhead and to the west, while Denver city
sky lights affect only the eastern 20% of the sky to varying levels. The
darkest skies and best seeing are overhead and toward the west. 9/95.
An all-sky visible-light image, 60 minutes on high speed film. In the original,
the Milky Way is clearly seen overhead and to the west, while Denver city
sky lights affect only the eastern 20% of the sky to varying levels. The
darkest skies and best seeing are overhead and toward the west. 9/95.
SUMMARY:
Mt.Evans offers an attractive continental INFRARED site with conditions
comparable, at times, to the best astronomical IR sites. The combination of
extreme high altitude, existing special use permits, nearby base camp,
acess to supplies and transportation, make Mt.Evans an appropriate site
for a major astronomical facility. If further details are of interest, or if
you want to participate in further site survey studies, please contact the
Department of Physics and Astronomy, University of Denver, or rstencel@du.edu.
Return to Mt.Evans News homepage.