 |

Results of the First Phase (Methods of Line-Broadening Analysis)
More information about the materials, methods of line-broadening analysis, and participating laboratories that provided measurements can be found on the preceding page. The participants that provided results for the round robin are acknowledged here. The report on the first round-robin phase is below. For the impatient, one can directly read Conclusions. Also, some parameters of interest are defined separately.
49 requests to participate in the round robin were received through the Web page. However, only 18 reports with results were received. Although it was recommended that the round-robin participants use a limited number of line-broadening methods to ensure a self-consistent analysis of the round-robin results, many used novel and/or insufficiently documented techniques. Therefore, an attempt was made to scale all the reported quantities into groups of results that are identically defined and therefore could be meaningfully compared. As it is customary used in the field, the report contains two groups of results: apparent volume-weighted domain size (VWDS) and upper limit of strain (ULS), which result from integral-breadth and similar methods of line-broadening analysis, and apparent area-weighted domain size (AWDS) and root-mean-square strain (RMSS), which follow from Fourier and related techniques. Furthermore, an initial screening of results was undertaken to eliminate those with clearly erroneous values of both domain size and strain. After the assessment, the results from 16 participants could be included in the final analysis. The participants in general analyzed different number of data sets, which gave different number of observables in calculating averages and standard uncertainties (SU) for the results reported here. Number of observables varied from minimum of 3 (“Fundamental Parameters” approach) to maximum of 43 (VWDS mean).
The annealed commercial CeO2 was used to correct for the instrumental contribution to the line broadening to facilitate line-broadening analysis (especially the Fourier deconvolution method). The analysis confirms that this did not influence results for domain size and strain. A comparative analysis with an NIST SRM660 LaB6 as an instrumental standard gave almost identical results (within a single standard uncertainty). All considered round-robin results yielded positive domain size. Most of the results gave very small positive or negative, or zero values of strain. The absence of substantial strain was expected for this material and is in accord with already published results (Audebrand, Auffrédic & Louër, 2000). However, some participants reported strains significantly larger than zero; maximum ULS reported was 0.04 (4 %), with the average value of 0.004(9), considering only the result that reported values of ULS larger than zero. These results were not routinely disqualified unless domain sizes were clearly incorrect. However, because it is assumed that strains significantly larger than zero result from an incomplete model for the size-broadened profile, as it is argued later in the report, the focus here is on the domain-size broadening effects only and an assumption is that the round robin CeO2 sample was nearly strain-free. It is important to note that there was a strong Gaussian component in pure physically broadened line profiles, which is therefore size-related.
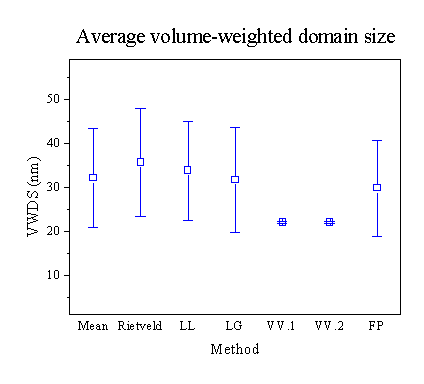
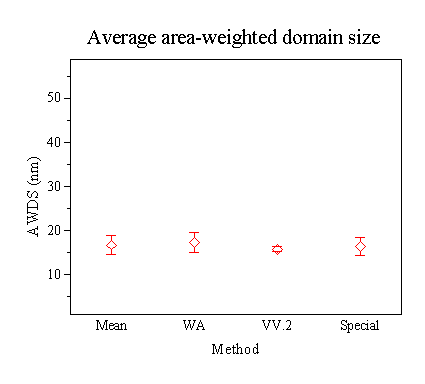
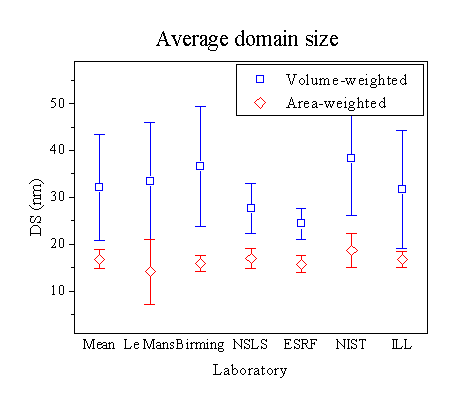
Figures 1 and 2 show the average values of VWDS and AWDS, respectively, determined by the round-robin participants using different line-broadening analysis methods. Despite standard uncertainties (SU) being relatively large for the VWDS, it is tempting to say that all the methods gave results that agree reasonably well. This is expected for samples without substantial strain broadening; with comparable size and strain broadening effects, there are systematic differences given by different methods (see, for instance, Balzar & Popović, 1996). However, an indication that the results should be more carefully assessed is given by Figure 3, where the average domain sizes, both volume and area-weighted, are plotted for different instruments. The first impression is that AWDS show much less scatter and with significantly smaller SU, similar to results in Figure 2, as opposed to Figure 1. An inspection of results for the VWDS shows that the results are clustered in two regions: below 25 nm with the mean (22.6 ± 0.9) nm and above 25 nm with a much larger scatter, (39 ± 10) nm. Participants that obtained results in the latter group did not analyze either NSLS or ESRF synchrotron data, which explains their smaller SU in Figure 3 (the means are significantly different only at better than 1 % significance level).


The reason why results for the VWDS are clustered in two separate groups deserves closer attention. It appears to be mostly because some participants reported strain significantly larger than zero. Therefore, part of the line broadening was attributed to the strain effects, which gave larger domain size and systematically shifted the averages in Figure 1 toward the larger domain sizes. Participants using the double-Voigt approaches (VV.1 and VV.2) in Figure 1 did not detect strain, which explains lower values for domain size. Another possible reason for discrepancy is an oversimplified analytical model for the size-broadened profile, that is, a single Lorentzian function. This is inherent to Lorentz-Lorentz (LL) and Lorentz-Gauss (LG) integral-breadth methods, and included in most of the “Fundamental-parameter” approaches. However, for strain-free samples, if the observed profile is fitted with a Voigt (or related) function and the subsequent analysis is performed according to one of the simplified integral-breadth methods, the difference between simplified and double-Voigt methods is minimal. In Rietveld refinement, the situation is different because it is up to a user to refine particular parameters. For instance, most of participants that obtained a measurable strain effect did not refine the Gaussian size term (proportional to 1/cos2q). Because there was a significant Gaussian component to physically broadened line profiles, it was probably erroneously absorbed into the Gaussian strain term (proportional to tan2q). This fact suggests caution when doing Rietveld refinements; although strain and size Gaussian terms have different angle dependence, the difference could be compensated by refinement of some other parameters that strongly correlate with profile parameters if refinement is not carefully conducted.
Participants that used Fourier methods that yield the AWDS, all reported no significant strain values, which explains uniformity of the AWDS results. However, because some Fourier methods used a simple Lorentzian model for a size-broadened file, it is interesting to note that these results did not give overestimated values of domain size. This is possible to understand in the framework of Voigt-function modeling in Fourier approach; the AWDS depends only on a Lorentzian part of the size-broadened profile (Balzar & Ledbetter, 1993).
In conclusion, the average results of the round robin for domain sizes are as follows:
VWDS = (32 ± 11) nm; AWDS = (16.8 ± 2.1) nm.
If one accepts that domain size estimates are more accurate for results obtained without significant strain broadening detected, the following seems to be a more credible result for both volume-weighted and area-weighted domain size:
VWDS = (22.6 ± 0.9) nm; AWDS = (16.8 ± 2.1) nm.
All the results indicated that the broadening is isotropic (that is, crystallographic-direction independent), which means that crystallites are approximately spherical. For a monodisperse system of spheres, the sphere diameter is related to apparent sizes as:
![]()
Therefore, for the monodisperse system of spheres
![]()
If we consider the most probable average result given by the round robin (VWDS = 22.6 nm; AWDS = 16.8 nm), this gives the ratio
![]()
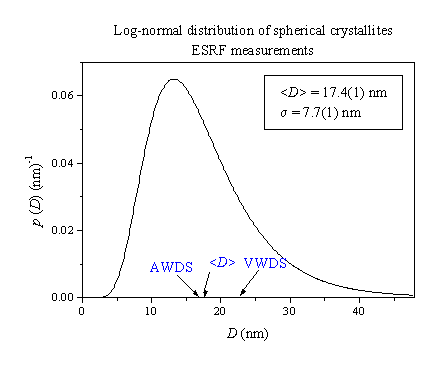
Thus, a relative narrow crystallite size distribution in the sample is likely. Recent analysis of a nanocrystalline CeO2 powder (Langford, Louër & Scardi, 2000) has found a log-normal distribution of crystallites. On this assumption, we modeled all reflections of ESRF measurements. The resulting average crystallite-size-distribution function is presented in Figure 4. The mean (first moment) is (17.4 ± 0.1) nm with the variance (59.3 ± 1.5) nm2. From the log-normal distribution, we can calculate the corresponding results for VWDS and AWDS:
VWDS(distribution) = (22.3 ± 0.5) nm; AWDS(distribution) = (16.6 ± 0.5) nm.
The agreement with round-robin average results is very good for both VWDS and AWDS. We can conclude that the log-normal crystallite size distribution is very likely in this CeO2 sample. Because the size distribution is relatively narrow, Voigt function (or its approximations, pseudo-Voigt and Pearson VII) can be successfully used to approximate pure physically broadened line profiles.


All the round-robin participants and instrument scientists that provided measurements are greatly acknowledged. Without either group, this round robin would not be possible. In particular, I am very much indebted to Nathalie Audebrand and Daniel Louër (University of Rennes I) for preparing the CeO2 round-robin specimen.
|
|
|
|
|
|
|
|
|
|
|
|
|
|
|
|
|
|
AWDS: Apparent area-weighted domain size, defined as the cross-sectional area (A) average of the measured thickness (T) of the crystal perpendicular to the reflecting planes:
![]()
The area-weighted measure is obtained from the Fourier coefficients for the small values of harmonic number.
Log-normal distribution: If spheres of diameter D are distributed according to the log-normal distribution characterized with the parameters w2 and g, the distribution function p(D) is given by:
![]()
RMSS: Root-mean-square strain; a function of averaging distance perpendicular to diffracting planes (Warren, 1969).
SU: Standard uncertainty (standard deviation) of a data set is defined in a common way as:
![]()
Here, s2
is the variance of a data set of size n with the mean
![]() .
.
ULS: Upper limit of strain, Dd/d, as derived from the Bragg’s law (Stokes & Wilson, 1944).
VWDS: Apparent volume-weighted domain size, defined as the volume (V) average of the measured thickness (T) of the crystal (perpendicular to the diffracting planes):
![]()
This value is normally obtained through integral-breadth methods.
Audebrand, N., Auffrédic, J.-P. & Louër, D. (2000). Chem. Mater. 12, 1791-1799.
Balzar, D. & Popović, S. (1996). J. Appl. Cryst. 29, 16-23.
Balzar, D. & Ledbetter, H. (1993). J. Appl. Cryst. 26, 97-103.
Langford, J. I. (1980). In Accuracy in Powder Diffraction, NBS Special Publication No. 567, pp. 255-269.
Langford, J. I., Louër, D. & Scardi, P. (2000). J. Appl. Cryst. 33, 964-974.
Stokes, A. R. & Wilson, A. J. C. (1944). Proc. Phys. Soc. London 56, 174-181.
Warren, B. E. (1969). X-Ray Diffraction, pp. 251-314. New York: Dover.