Time and Frequency Domains
The Frequency Domain
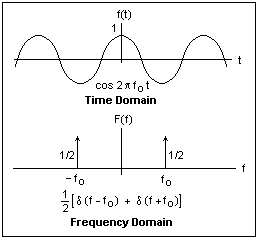 The signals we deal with in electronics are functions of time, like the sinusoidal signal cos 2πft shown at the top in the figure at the right. We imagine the signal to extend to infinity in both directions. The signal can also be represented as a function of frequency, and this representation is shown below. The arrows represent Dirac delta functions, which are very convenient for describing things of definite frequency. The Dirac delta function δ(t) is zero for t unequal to zero, but is infinite at t = 0 in such a way that its integral is unity, as shown at the left.
  . The numbers beside the arrows show the coefficients of the delta functions. Each delta function represents an exponential, ej2πft, and there is one at positive frequency, and another at negative frequency, so the function is [ej2πft + e-j2πft]/2, which we know is the cosine. What would be the frequency domain representation of the sine?
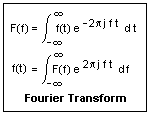 In the frequency domain, a function is represented by the coefficients used to express it as a superposition of exponential functions of time in the time domain. This relation is called the Fourier transform, the integral transform shown in the figure. F(f) is the function in the frequency domain, while f(t) is the function in the time domain. You can substitute the delta functions in the F(f) for the cosine signal above in the integral, and get f(t) immediately (it is easy to integrate delta functions--they merely pick out a value). There are tables of Fourier transforms, so you do not have to actually do these integrals.
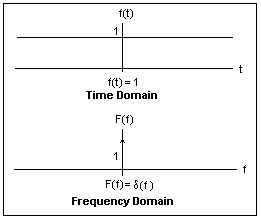 The frequency domain representation, or Fourier transform, of the DC signal shown in the figure is a delta function at zero frequency, with a coefficient equal to the value of the signal. Things that are greatly extended in the time domain are tightly bunched in the frequency domain.
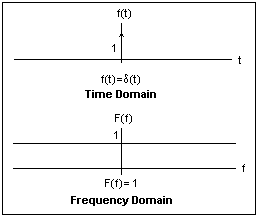 This relation is mutual, since a sharp shock at t = 0, represented by a unit delta function, is represented as a superposition of all frequencies with equal amplitudes, as the figure illustrates. The use of complex exponentials is very convenient here, since complex coefficients can express phase differences as well as magnitudes, in one quantity. Although our time domain signals are real, the frequency domain representations may be complex.
 When we have a signal limited in duration, such as the rectangular pulse shown at the right, the frequency domain representation is no longer a delta function, but broadens into a continuous, limited spectrum. (The signal in frequency space is called a spectrum by analogy with an optical spectrum that spreads out the wavelengths.) Note the reciprocal relation: the narrower the pulse in the time domain, the wider the spectrum in the frequency domain. The area of the pulse, here unity, is also the height of the spectrum at zero frequency, another useful fact. The rectangular pulse is represented as the sum of two unit steps u(t), where u(t) = 0 for t < 0, and = 1 for t > 0.
The frequency domain representation is useful chiefly because most electronic systems are at least approximately linear, which means that the output of the system for several inputs applied at the same time is the sum of the outputs for each input separately. That is, the system exhibits the principle of superposition. This is always true for any circuit made up of linear circuit elements: resistors, capacitors and inductors. We can analyze such a system in the frequency domain, and can superimpose the results to find the response to any signal at all. This is the normal way of treating AC circuits, with which you are probably very familiar.
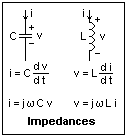 Since v = Ri in the time domain, the same relation will hold in the frequency domain, since R is simply a constant, and can be taken outside the Fourier integral. Capacitors and inductors, however, have a more complex behavior that can be expressed by differentiation, as shown in the figure. Note carefully the positive directions of the current and voltage. The wonderful thing about the frequency domain is that differentiation with respect to time becomes multiplication by j2πf, or jω for convenience, where the angular frequency ω = 2πf. This involves a phase shift from the j as well as a change in magnitude. In the time domain, a circuit is described by differential equations, which are difficult to solve, but in the frequency domain, it is described by algebraic relations, which are easily solved. One can simply use jωL and 1/jωC the same way R is used in DC circuits, and generalize resistance into impedance.
Single-Pole Responses
 Two circuits of very common occurrence are shown at the right. These RC circuits appear everywhere in electronics, so a familiarity with them is rewarding. The figure shows how the circuits can be described both in the time domain and in the frequency domain. In the frequency domain, the results can be applied immediately, but in the time domain, we have differential equations to solve. We assume here that vs is a source of zero internal resistance, and that the output is not loaded. Real circuits should be converted to this form for the purposes of analysis. It is easy to identify these circuits if it is remembered that a capacitor is an open circuit to DC, but a short circuit at high frequencies.
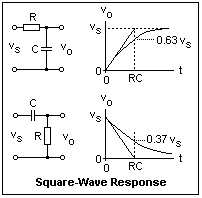 The time domain response of these circuits to a step-function input is shown in the figure. The input is initially at zero, then rises abruptly to vs at t = 0, afterwards remaining constant. In the low-pass circuit, the output voltage begins at zero (held down by the capacitor) and rises to the final value with a time constant τ = RC. At t = τ, the voltage has risen to 63% of its final value. Note how the initial slope is related to the time constant. After several time constants, the output is practically at its final value. The high-pass circuit, on the other hand, passes the applied voltage through at once, and the output voltage then decreases exponentially, passing through 37% of its inital value after one time constant. After several time constants, the output is practically zero.
The rise time of a pulse is the time taken to go from 10% to 90% of its final value. From the expression for the output voltage, vo = vs [1 - exp(-t/RC)], this time for a step input can easily be found to be 2.2RC = 2.2 τ. Many systems (such as oscilloscopes) are low-pass systems described by a bandwidth f. This is related to the time constant through τ = 1/2πf. In terms of f, the rise time is 0.35/f. For a 100 MHz scope, the rise time is 3.5 ns.
The rise time tr of the trace observed on the screen depends on the rise time of the scope toas well as the rise time of the signal, ts. The relation is to = √ [ts2 + to2]. If the rise time of the signal is about three times larger than the rise time of the scope, the effect of the scope can be neglected. This means that a 100 MHz scope can measure a rise time of about 10 ns, and a 20 Mhz scope about 52 ns.
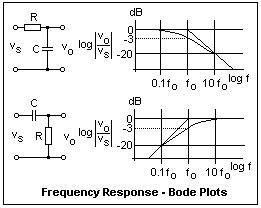 The frequency domain response of the same two circuits is shown in the figure. The plot has been done in a special way, which makes drawing the curves very easy. The amplitude response in decibels, dB = 20 log (vo/vs), is plotted against log f. The logarithms are to base 10. For the low-pass circuit, the curve is flat out to the corner frequency fo, then falls linearly with constant slope of -20 dB per decade of frequency. At the corner, the response is -3 dB, which corresponds to a voltage ratio of 1/√2. The precise curve differs significantly from the straight lines only between about 0.3ωo and 3ωo, and is easily sketched in. All this can be worked out from the expression for the amplitude response, looking at the limits and even actually making a plot to see what it looks like. Of course, start by finding the magnitude of the response, multiplying by the complex conjugate and taking the square root. A plot of dB gain against log frequency is called a Bode plot.
The phase shift can be plotted in the same way, approximately as a straight line from 0.1 fo to 10 fo, from 0 to -90° for the lowpass and +90° to 0 for the highpass. The phase plots are not generally needed, however. Note that it all happens between 0.1 fo and 10 fo in any case, both for phase and amplitude. Outside this range, the behavior is very simple, either constant or at a 20 dB/decade slope. The response of these RC circuits is called single-pole, because they contain the frequency to the first power in the denominator. The low-pass response, for example, is written 1 / (1 + s/ωo), where s has been written for jω, and ω is, of course 2πf. This is treated as a function of the complex variable s, and has a pole at s = -ωo. The variable s is the same one that occurs in the Laplace transform, which you may remember. In the complex s-plane, frequency is along the imaginary axis.
The RC circuits that we have been studying are excellent examples of linear systems. In fact, let's take a little rodeo into this theory because it is so pretty and useful, and well illustrates the relations between the time and frequency domains. Let the input to such a system be y(t), and the output produced by this input, x(t). Since the system is linear, the input Ay(t) will produce the output Ax(t), and the input y(t) + v(t) will produce the output X(t) + W(t) (where W(t) is the output corresponding to v(t)). One very special input is the impulse, the unit delta function δ(t), which is zero except at the instant t = 0. If this is a voltage source, as here, this means that the input is shorted for all but a brief interval at t = 0. This jolt produces an output h(t), called the impulse response. It happens that if we know h(t), we can find the output for any y(t) by the convolution integral x(t) = h(t) ⊗ y(t). [your browser will give some symbol that eventually should be the correct one, an X in a circle.] In the laboratory, an impulse source is impractical, but we can use a unit step function, which is the integral of the impulse function. The output is, by linearity, just the integral of h(t). The impulse response describes the system in all respects.
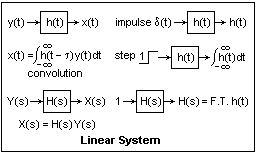 This is shown schematically in the diagram at the right, where the explicit form of the convolution integral is shown. In the frequency domain, we will have an input Y(s), the Fourier transform of y(t), which produces an output X(s), the transform of x(t). They are related by simple multiplication by a function H(s), called the system function, instead of by the more complicated convolution that is necessary in the time domain. H(s) is just the Fourier transform of h(t). All these things are proved in any text on linear systems, and the proofs are easy, using the Fourier transform definitions. Everything is easier in the frequency domain: integration and differentiation are merely division and multiplication by jω, and the convolution is merely the product.
 As an example, consider the low-pass circuit. For t < 0, the input is a short, so the capacitor is discharged. Then a jolt arrives at t = 0, and the current becomes δ(t)/R (whatever voltage is across C is negligible compared to the jolt). This current charges the capacitor to a voltage 1/RC, as shown in the figure. Now the input is again shorted, and the capacitor discharges through the resistor R exponentially with time constant RC, as we well know. The output is the decreasing voltage across C. Now we can find H(s) by taking the Fourier transform of h(t). Do this, the integral is easy! The result is H(s) = 1 / 1 + jωRC, just what we found above by a different method.
The high-pass circuit is similar, but there is a little trick. The capacitor no longer holds the output down, and the delta function gets through, so it must appear in h(t) = δ(t) - exp(-t/RC)/RC. The delta function gives an extra 1 in the transform, which is 1 - 1 / 1 + jωRC = jωRC / 1 + jωRC, exactly what it should be.
If you integrate the h(t)'s we found, you will recover the step responses that we calculated earlier from the differential equations that represent the systems in the time domain. All this hangs together very nicely, and gives deep insight into many things.
Experiments
To study signals that vary with time, exploring other regions of the frequency domain than f = 0, an oscilloscope is an essential tool. Next to the multimeter, it is the most useful tool in electronics, and will furnish hours of fun. I can barely imagine life without oscilloscopes, but at one time electrical workers had to live without meters! A scope is an expensive tool, however, but a used scope will serve excellently. A 20 MHz, dual-trace analog scope is excellent for studying electronics, and will fulfill all your needs. If you can find some university eager to give its students more than is desirable in the way of scopes, you may find some very good deals. Unless you can imagine yourself in earlier years using a Polaroid scope camera, you do not need a digital scope, and may even find one annoying. Many current scopes do far too much for the user, and are hard to learn to use. If you happen to need the features, of course, the extra baggage is welcome.
I have been very happy with an Hitachi Denshi 100 MHz scope (V-1050F) that is more than is needed for ordinary electronics, but was useful for computers and digital logic. This instrument has an excellent, stable delayed sweep that proved very useful. Again, features like this are not necessary on a first scope. Whatever scope you acquire, read the manual thoroughly and try everything out. Use proper probes set to 10X. These will have an input resistance of 10 MΩ, and input capacitance of 12 pF, so your circuits will not be affected by probing. At the scope input, these are 1 MΩ and 28 pF. Any shielded lead will add loads of capacitance. Adjust the probe compensation using a good square wave, and leave the probes attached permanently. Check the scope calibration (most scopes have a calibration terminal that can be used for this purpose, as well as for probe compensation). The ground must be the same for both probes, since it is connected with the scope chassis ground. You can't invert the polarity, as you can with a multimeter. Use the AC-GND-DC coupling of the probes intelligently. The AC coupling will go down to 10 Hz or so, and eliminates DC bias on the trace.
The scope displays a short chunk of time on its screen. The secret of using a scope is to make whatever you are observing periodic in time. When you display it over and over, it looks constant, and you can observe it easily. The purpose of the scope trigger is to start the display off at the same phase of events each time, and there is quite a bit of control available. Normally, the trigger is derived from the observed waveform, and you can select the level and slope at which the trigger fires. Of course, the same trigger applies to both traces of a dual-trace scope, and is derived from one or the other. The reason for the dual-trace feature is that one usually wants to compare two waveforms at the same time. The two traces can appear alternately (ALT), or the beam can switch rapidly from one to the other (CHOP). As long as the repetition rate is greater than the persistence of vision, use ALT. Use CHOP to avoid seeing first one, then the other, trace. There is only one electron beam.
A powerful method of viewing a short interval repeatedly is to use an external trigger source that triggers the circuit under test and the scope at the same time, so that the trigger is not derived from the observed signal, but from the independent source.
The scope can be used to measure voltage (current by the voltage across a resistance), frequency or repetition rate, time delay or phase difference between two signals, rise and fall times of pulses, and to display two signals in an X-Y plot (Lissajous' figures). My scope has a single-shot feature that was for use with a camera for photographic recording (the reticle is also illuminated), but this is now better done with a storage scope. When using your scope, be sure that the trace is focused and accurately follows the time axis, and that any display is properly triggered and stable. Anything else is amateur night.
Test signals can be obtained from a function generator, which provides sine, square and triangle waves from 0.1 Hz to 1 MHz (typically), with an adjustable DC bias, and a connection for controlling the frequency over a limited range by an applied voltage. The sine and square waves are the most useful, and there may be a TTL-level output that gives proper rise and fall times for digital circuits. This is a very useful instrument, and is not very expensive. Nevertheless, an inexpensive substitute can be constructed on your breadboard for a few dollars from an ICL8038 function generator chip (if you can find one!) and an op-amp for a buffer. A scope and a function generator offer you many opportunities for testing and measurement, and hours of enjoyment.
Make up an RC circuit, with, say R = 10k and C = 0.01 μF, which gives τ = 0.1 ms and fo = 1590 Hz. Apply a square wave as the input, say with a frequency of 500 Hz (half period 10 time constants), and note the responses. Check the levels at one time constant, the initial slopes, and so forth. All the exercises here are excellent for gaining skill in using the oscilloscope.
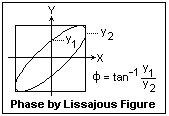 Now apply a sine wave, and measure the gain (here a loss, of course) and phase shift at a number of frequencies from 100 Hz to 10 kHz. Plot the dB gain against log f and compare with the Bode plots. This would be a good place to try measuring the phase shift by the Lissajous figures, putting the input on the X axis and the output on the Y axis. Go from 0° to 90° in each case, and note the form of the figure. The way to deduce the phase angle is shown at the right. There are several methods, but I find this one easiest to use. Estimates are often what are wanted, not exact values, and this method works well for this. If you happen to have two sinewave sources, observe the Lissajous figures for different multiples--this can be quite entertaining.
Simulate an amplifier with a passband from (about) 100 Hz to 5000 Hz by using two RC circuits, one lowpass at the output, and the other highpass at the input, which is typical of most capacitor-coupled amplifiers. Use a unity-gain op-amp buffer between the two RC elements to keep things simple. Apply a square wave to the input and note the shape of the output waveform, which shows a rise time and a sag. The sag is the result of the lower corner frequency, while the rise time is governed by the upper corner frequency. We already know the relation between the rise time and the upper corner frequency, t = 0.35/f. Work out the relation between the sag and the lower corner frequency (see below). The square-wave test can show a lot about an amplifier at a single glance.
Use a square wave where the sag in the output is practically linear, and measure the slope of a convenient portion of it. If the peak-to-peak voltage of the square wave is V (this is the input voltage times the gain), then the exponential decay is through V/2 volts, and dv/dt = V/2τ = πfV, where f is the lower corner frequency. My amplifier had an input with R = 10k and C = 0.1 μF, so f was 159 Hz. I measured a slope of 8500 V/s, so the experimental value of f = 150 Hz, which is not too bad agreement. On the other end of the bandwidth, the rise time was 0.040 ms, giving a corner frequency of 8750 Hz. The actual corner frequency was 7234 Hz (2.2k and 0.01 μF), so this also is not bad for such a rough measurement. The Bode plot showed the -3 dB point in the proper place. The X-Y display showed the phase relations very well as the input frequency was varied across the bandwidth of the amplifier.
References
- Hitachi Denshi, Inc., Operation Manual, Model V-1050F Oscilloscope (no date)
- Dynascan Corporation, Instruction Manual, Function Generator, B&K Precision 3010 (Chicago: Dynascan, 1981)
- This material is treated in most texts in circuits or signals and systems. See, for example, the concise text of E. A. Faulkner, Introduction to the Theory of Linear Systems (London: Chapman and Hall, 1969).
Return to Electronics Index
Composed by J. B. Calvert
Created 15 July 2001
Last revised 16 July 2001
 The signals we deal with in electronics are functions of time, like the sinusoidal signal cos 2πft shown at the top in the figure at the right. We imagine the signal to extend to infinity in both directions. The signal can also be represented as a function of frequency, and this representation is shown below. The arrows represent Dirac delta functions, which are very convenient for describing things of definite frequency. The Dirac delta function δ(t) is zero for t unequal to zero, but is infinite at t = 0 in such a way that its integral is unity, as shown at the left.
  . The numbers beside the arrows show the coefficients of the delta functions. Each delta function represents an exponential, ej2πft, and there is one at positive frequency, and another at negative frequency, so the function is [ej2πft + e-j2πft]/2, which we know is the cosine. What would be the frequency domain representation of the sine?
 In the frequency domain, a function is represented by the coefficients used to express it as a superposition of exponential functions of time in the time domain. This relation is called the Fourier transform, the integral transform shown in the figure. F(f) is the function in the frequency domain, while f(t) is the function in the time domain. You can substitute the delta functions in the F(f) for the cosine signal above in the integral, and get f(t) immediately (it is easy to integrate delta functions--they merely pick out a value). There are tables of Fourier transforms, so you do not have to actually do these integrals.
 The frequency domain representation, or Fourier transform, of the DC signal shown in the figure is a delta function at zero frequency, with a coefficient equal to the value of the signal. Things that are greatly extended in the time domain are tightly bunched in the frequency domain.
 This relation is mutual, since a sharp shock at t = 0, represented by a unit delta function, is represented as a superposition of all frequencies with equal amplitudes, as the figure illustrates. The use of complex exponentials is very convenient here, since complex coefficients can express phase differences as well as magnitudes, in one quantity. Although our time domain signals are real, the frequency domain representations may be complex.
 When we have a signal limited in duration, such as the rectangular pulse shown at the right, the frequency domain representation is no longer a delta function, but broadens into a continuous, limited spectrum. (The signal in frequency space is called a spectrum by analogy with an optical spectrum that spreads out the wavelengths.) Note the reciprocal relation: the narrower the pulse in the time domain, the wider the spectrum in the frequency domain. The area of the pulse, here unity, is also the height of the spectrum at zero frequency, another useful fact. The rectangular pulse is represented as the sum of two unit steps u(t), where u(t) = 0 for t < 0, and = 1 for t > 0.
 Since v = Ri in the time domain, the same relation will hold in the frequency domain, since R is simply a constant, and can be taken outside the Fourier integral. Capacitors and inductors, however, have a more complex behavior that can be expressed by differentiation, as shown in the figure. Note carefully the positive directions of the current and voltage. The wonderful thing about the frequency domain is that differentiation with respect to time becomes multiplication by j2πf, or jω for convenience, where the angular frequency ω = 2πf. This involves a phase shift from the j as well as a change in magnitude. In the time domain, a circuit is described by differential equations, which are difficult to solve, but in the frequency domain, it is described by algebraic relations, which are easily solved. One can simply use jωL and 1/jωC the same way R is used in DC circuits, and generalize resistance into impedance.
 Two circuits of very common occurrence are shown at the right. These RC circuits appear everywhere in electronics, so a familiarity with them is rewarding. The figure shows how the circuits can be described both in the time domain and in the frequency domain. In the frequency domain, the results can be applied immediately, but in the time domain, we have differential equations to solve. We assume here that vs is a source of zero internal resistance, and that the output is not loaded. Real circuits should be converted to this form for the purposes of analysis. It is easy to identify these circuits if it is remembered that a capacitor is an open circuit to DC, but a short circuit at high frequencies.
 The time domain response of these circuits to a step-function input is shown in the figure. The input is initially at zero, then rises abruptly to vs at t = 0, afterwards remaining constant. In the low-pass circuit, the output voltage begins at zero (held down by the capacitor) and rises to the final value with a time constant τ = RC. At t = τ, the voltage has risen to 63% of its final value. Note how the initial slope is related to the time constant. After several time constants, the output is practically at its final value. The high-pass circuit, on the other hand, passes the applied voltage through at once, and the output voltage then decreases exponentially, passing through 37% of its inital value after one time constant. After several time constants, the output is practically zero.
 The frequency domain response of the same two circuits is shown in the figure. The plot has been done in a special way, which makes drawing the curves very easy. The amplitude response in decibels, dB = 20 log (vo/vs), is plotted against log f. The logarithms are to base 10. For the low-pass circuit, the curve is flat out to the corner frequency fo, then falls linearly with constant slope of -20 dB per decade of frequency. At the corner, the response is -3 dB, which corresponds to a voltage ratio of 1/√2. The precise curve differs significantly from the straight lines only between about 0.3ωo and 3ωo, and is easily sketched in. All this can be worked out from the expression for the amplitude response, looking at the limits and even actually making a plot to see what it looks like. Of course, start by finding the magnitude of the response, multiplying by the complex conjugate and taking the square root. A plot of dB gain against log frequency is called a Bode plot.
 This is shown schematically in the diagram at the right, where the explicit form of the convolution integral is shown. In the frequency domain, we will have an input Y(s), the Fourier transform of y(t), which produces an output X(s), the transform of x(t). They are related by simple multiplication by a function H(s), called the system function, instead of by the more complicated convolution that is necessary in the time domain. H(s) is just the Fourier transform of h(t). All these things are proved in any text on linear systems, and the proofs are easy, using the Fourier transform definitions. Everything is easier in the frequency domain: integration and differentiation are merely division and multiplication by jω, and the convolution is merely the product.
 As an example, consider the low-pass circuit. For t < 0, the input is a short, so the capacitor is discharged. Then a jolt arrives at t = 0, and the current becomes δ(t)/R (whatever voltage is across C is negligible compared to the jolt). This current charges the capacitor to a voltage 1/RC, as shown in the figure. Now the input is again shorted, and the capacitor discharges through the resistor R exponentially with time constant RC, as we well know. The output is the decreasing voltage across C. Now we can find H(s) by taking the Fourier transform of h(t). Do this, the integral is easy! The result is H(s) = 1 / 1 + jωRC, just what we found above by a different method.
 Now apply a sine wave, and measure the gain (here a loss, of course) and phase shift at a number of frequencies from 100 Hz to 10 kHz. Plot the dB gain against log f and compare with the Bode plots. This would be a good place to try measuring the phase shift by the Lissajous figures, putting the input on the X axis and the output on the Y axis. Go from 0° to 90° in each case, and note the form of the figure. The way to deduce the phase angle is shown at the right. There are several methods, but I find this one easiest to use. Estimates are often what are wanted, not exact values, and this method works well for this. If you happen to have two sinewave sources, observe the Lissajous figures for different multiples--this can be quite entertaining.