| |
Abstract and Notes
|
|
Ground-Penetrating
Radar (GPR) Mapping as a method for planning excavation strategies,
Petra, Jordan
GPR Data Processing
 Why
GPR Data needs to be processed: Why
GPR Data needs to be processed:
- Typical GPR reflection profiles contain noise and unwanted reflections
that are produced by:
- antenna "ringing"
- differences in the coupling of energy with the ground
- multiple reflections that occur between the antenna
and the ground surface
- system and background "noise"
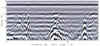
Background
Removal is the first processing stage, which will remove the horizontal
lines common in profiles.
- Horizontal lines in reflection profiles are caused by much of
the "noise" listed above. They obscure the "real"
reflections and must be removed.
Figure
28
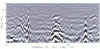
- The removal process is a simple arithmetic calculation that can
be done with digital data. All reflections that occur at the
same time along the whole profile are averaged, and this average
is subtracted from all the individual reflections that make up the
profile. When this is done the profile is "cleaned up"
and contains only the non-horizontal reflections, which are those
that come from within the ground.
Figure
29
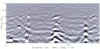
Point
Source Hyperbola Tail Removal
- Reflection profiles also contain high-angle reflections that are
the tails of hyperbolas generated from buried rocks and walls.
Although these reflections can be helpful in visual interpretation,
because they show the tops of walls and individual rocks, they tend
to make profiles "busy" and produce blurry maps when processed
into amplitude slices.
- The tails of the hyperbolas can be removed, leaving only the reflections
at the apex, which represent the true location where the top of
the feature is buried.
Figure
30
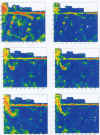
- To illustrate the difference between maps that have been processed
to remove the hyperbola tails, and those that are not, a comparison
was done on slices in Grid 2. In Figure 31 maps are compared
that were constructed with the tails still in the data, and after
they were removed. Those with the tails removed are much more
accurate, as they do not contain the spurious reflections of the
hyperbola axes.
- Figure31
Production
of Rendered Images of Processed Reflections
- Once data are processed by removing unwanted noise, and the point
source hyperbola tails are removed, the resulting reflection profiles
are ready for additional image production.
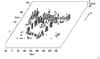
- Thirty-five horizontal slices were made of the data in Grid 2.
These data were then imported into a volumetric-data visualization
program that can isolate amplitude anomalies and render them into
three-dimensional shapes. When this was done for all the highest
amplitudes in Grid 2 a three-dimensional image of buried northern
structure was produced, which was then shaded to enhance the reflections.
This image mimics the actual location of the structure in the ground.
To play this video, click on the thumbnail image below:
Figure 32
|
|


